


The Man Is Still Falling
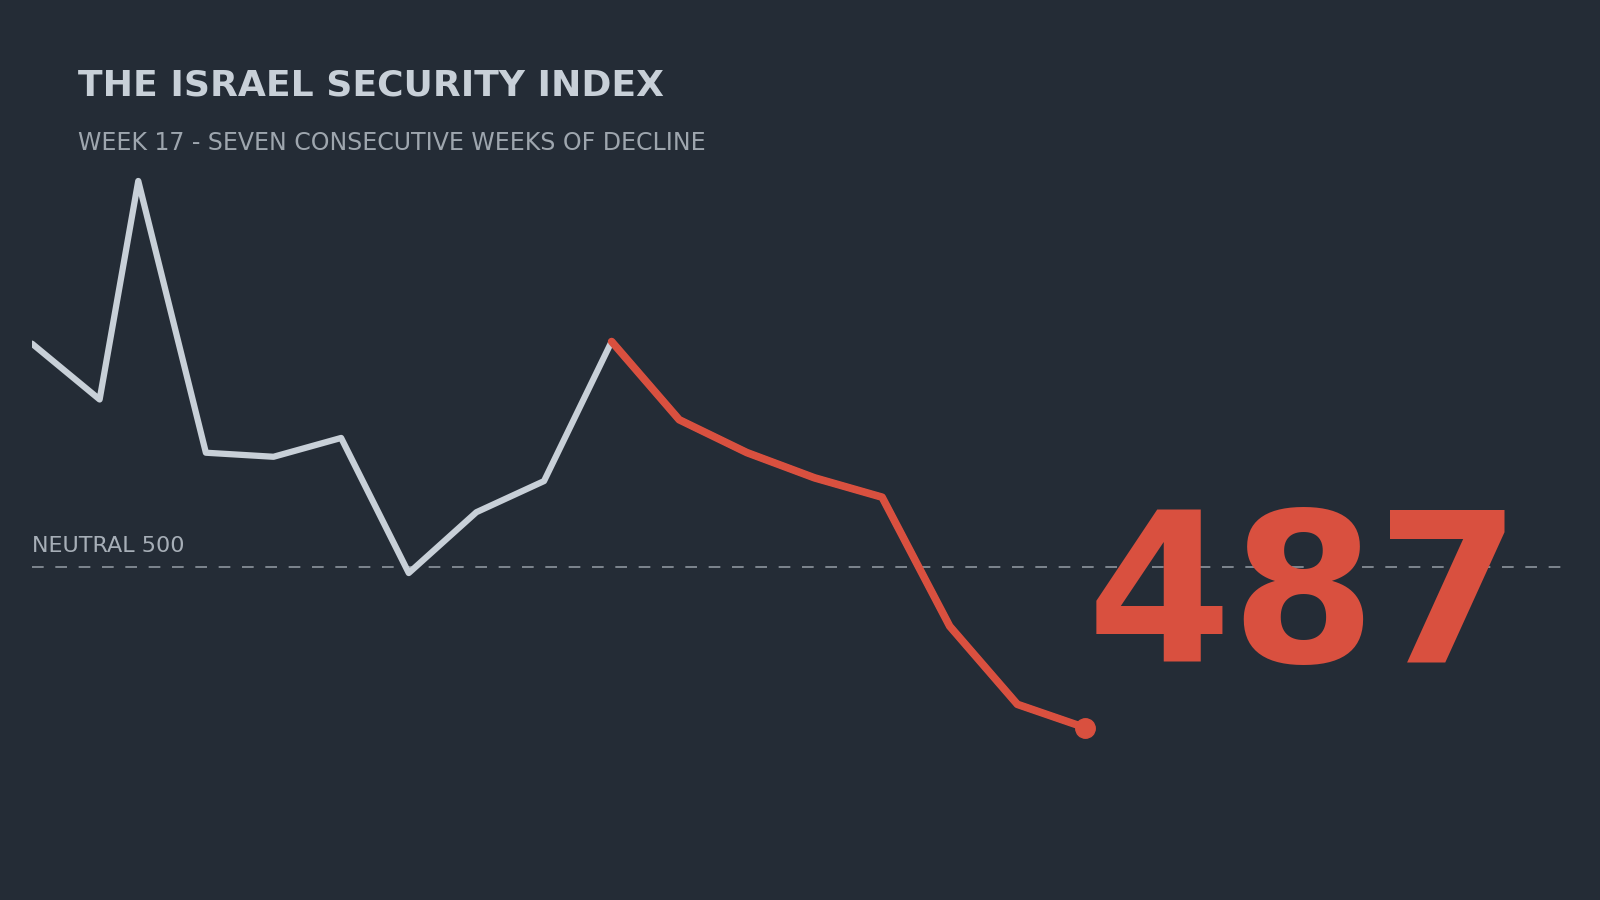
There is an old joke. A man falls off the Empire State Building. Passing the 35th floor, he sees a friend in an open window. The friend yells: how are you doing? He yells back: so far so good.
In June, a magazine editor asked me to look at Trump’s Iran policy through a gambler’s perspective. That question produced an article. It also produced something the editor did not ask for: a number.
If you are going to think about geopolitical risk the way a gambler thinks about odds, you need a number you can be wrong about. Not a framework. Not a narrative. A number. I built the Israel Security Index. It aggregates what traders on global prediction markets are willing to bet on outcomes that directly affect Israeli security: ceasefire durability, Iran’s nuclear timeline, the Hormuz chokepoints, the diplomatic architecture, the political alliances. Real money. Weekly. The index converts those price signals into a single number anchored at 500. Above 500, conditions are improving. Below 500, they are deteriorating.
Seventeen weeks in, I have a number for that joke.
It is 487. The man is still falling. He has been falling since 1948.
David Ben-Gurion declared statehood on a Friday afternoon in May 1948. By the following morning, five Arab armies were at the border. The opening coin flip was not a metaphor. It was a military fact.
Israel has been a 511 state since its first morning. The wars it won did not produce security. They produced intervals. The peace treaty with Egypt in 1979 moved the number. So did Jordan in 1994. Oslo moved it for a while. Each development reduced a genuine danger. None created permanence. The number came back. It always came back to the same band: marginally above neutral, never decisively above it, never collapsing below it for long.
This is not a failure of Israeli policy or Israeli arms. It is the arithmetic of a nine-million-person state in a neighborhood that has never reached consensus on whether that state is legitimate. The math has been the same since 1948. The index just gave it a number.
My reading of that record puts the number, for 78 years, at approximately 511. The index cannot backcast to 1948. But 17 weeks of data have landed exactly where the reading says they should.
It is now 487. And it has been falling for seven consecutive weeks.
Here is what the index proves after 17 weeks, stated plainly.
It proves that the prediction market consensus on Israeli security has been deteriorating continuously since early August. It proves that the deterioration is located entirely in the Iran layer, not in the active conflict zones. It proves that the June diplomatic optimism, the brief window when real-money traders were pricing a path to stability, has been fully reversed and then some. It proves that traders with real money on the line are pricing an oil shock at nearly 50-50, an Iranian open-warfare posture at 30%, and a military clash between Israel and a NATO member at 13%.
It does not prove that war is coming. Seventeen weeks is a short series. Markets can be wrong. Probabilities are not outcomes.
But the index was built to answer one question, the one the editor asked in June: what does the situation look like when you remove the editorial instinct to reassure?
Seven consecutive weeks. One direction. 487.
That is the answer the markets are giving.
The index started at 517 in early June. It rose to 529 on June 15, the week the US-Iran Memorandum of Understanding was signed in Versailles. That was the high. The markets were pricing a genuine diplomatic framework: a path toward de-escalation, a ceiling on the nuclear timeline.
That optimism lasted about three weeks.
By late June the number had retreated to 508. It held there through early July, then broke below 500 for the first time on July 13, the week the deal track looked dead. It recovered partially, climbed back to 517 in early August on ceasefire optimism. Then it began a decline that has not stopped.
Seven consecutive weeks down. From 517.26 to 487.74. A loss of 29.5 points since the August peak.
The index has never been this low in 17 weeks of tracking. The June MOU optimism is entirely gone. The index is now lower than it was before the deal was signed.
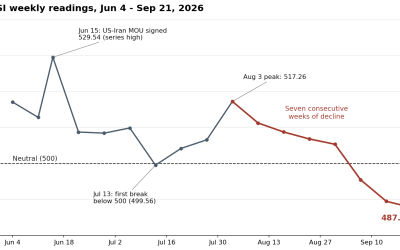
ISI weekly readings, June 4 through September 21, 2026. High: 529.54 on June 15, the week the US-Iran MOU was signed. Current: 487.74, the seventh consecutive weekly decline and the lowest reading in the series. Source: 40+ contracts across Kalshi, Polymarket, and Meticulous.
The decline is not coming from where you would expect.
Four clusters make up the index: Active Front, Strategic Support, Governance/Coalition, and Regional/Existential. This week those four sit at 527, 527, 526, and 426.
Three clusters stable. One in collapse.
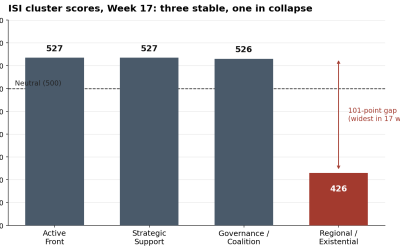
The Gaza front, strategic support, and coalition politics are pricing at normal operating levels. The Iran layer is not. Source: Israel Security Index, 40+ contracts across Kalshi, Polymarket, and Metaculus, week ending September 20, 2026.
The Gaza front, the northern border, Israeli coalition politics: the markets are pricing these at roughly normal operating levels for a country that has managed existential risk for 78 years. That is not optimism. It is the market’s version of: this is the baseline, we have seen this before.
The problem is the fourth cluster. The Regional/Existential layer tracks Iran’s nuclear trajectory, the Strait of Hormuz, the US-Iran diplomatic architecture, and the broader escalation environment. It sits 101 points below the other three. That gap is the widest in 17 weeks of tracking.
The markets are not worried about Gaza. They are worried about Iran, oil, and airspace. And they have been expressing that worry, in dollars, for seven straight weeks.
This week we completed the most comprehensive scan of prediction market coverage since the pilot began. Across Kalshi, Polymarket, and Metaculus, the three major platforms carrying Israeli security-adjacent contracts, we found four significant gaps in what the index was measuring and filled them.
WTI crude oil above $115 by year-end: 47% on Kalshi, $9.28 million in volume, up from 30% three months ago. The traders on that contract are not talking about supply and demand. They are linking the move explicitly to stalled Iran-Oman negotiations and Houthi escalation in the Red Sea. The oil price market is functioning as a real-time regional escalation proxy. Adding it correctly to the index pushed the reading down another two and a half points.
Iran closing its own airspace by December 31: 30%, $9.5 million on Polymarket. This is different from the Israel airspace contract already in the model. When Iran closes its airspace, it is not being defensive. It is communicating that it has accepted the operational reality of open warfare. That contract was sitting on a major platform with nearly ten million dollars behind it and we were not counting it.
The Bab el-Mandeb Strait: $13.7 million on Polymarket, 19% probability of effective closure. The Red Sea chokepoint, the one the Houthis have been targeting for two years, is a different geography and different threat architecture from the Strait of Hormuz. Volume doubled since August. We were not tracking it.
And then the one that belongs in a separate category. Israel and Turkey in a military clash before 2027. Polymarket. 13%. $418,000.
Thirteen percent is not a prediction, and $418,000 is not deep liquidity. I would not lean on the second digit. But it is a number that was not discussable in serious security circles five years ago. A NATO member in armed conflict with Israel. The probability is low enough that most analysts will not write about it. That is probably the wrong call.
The more important finding from the scan was not a contract. It was an absence.
Across all three platforms, in tens of millions of dollars of Israeli security-adjacent prediction market volume, there is not a single contract that measures China’s role. Not as Iran’s primary oil customer. Not as the diplomatic actor whose equities have to be satisfied in any final nuclear deal. Not as the structural reason that maximum-pressure sanctions on Iran produce maximum inconvenience rather than maximum pressure.
China buys roughly half of Iran’s oil exports. That one fact sets the ceiling on what sanctions can achieve. Remove Chinese demand and the Iranian economy faces genuine crisis. Keep Chinese demand and you get the current situation: a nuclear program that advances, a diplomatic framework that periodically forms and collapses, and a regional architecture that slowly deteriorates while the principals negotiate.
Prediction markets cannot price this because China’s role is a structural condition, not a resolvable binary event. You cannot write a contract that pays out when Beijing decides to enforce sanctions it has never agreed to enforce. So the markets do not try. And the index, which is built on what markets can price, cannot measure it.
This is not a flaw in the methodology. It is a finding about the limits of every analytical instrument currently available. The variables most likely to determine whether the current deterioration becomes a regional war: China’s posture, Russia’s military exports to Iran, the institutional antisemitism eroding Western support for Israel as a strategic partner. No market on earth will price them.
The index catches what the markets see. The markets cannot see the thing that matters most.
So what do you do with 487?
The same thing Ben-Gurion did with whatever number he was carrying on the morning of May 15, 1948, when the armies arrived. Not despair. Not false hope. Precision. You protect the alliances that keep the number above neutral. You retain enough strength that enemies understand the cost of testing it. You pursue agreements that buy real increments, even if they do not bring a new world. You do not confuse a calm week with a solved problem. And you do not confuse a bad week with the end.
The index did not start at 517 because the situation was good. It started at 517 because that is where the market opened. It has been falling because the regional architecture is deteriorating in ways the official conversation is not yet willing to state plainly. The gap scan found the evidence in the prices that real people set with real money on questions the newspapers are not asking.
The ceiling argument I made in June still holds. 511 is the permanent operating condition of a state that chose to exist in a place where its existence remains contested. The man has been falling since 1948. The index just gave it a number.
What is new is that the number is now below the ceiling. And the direction is down.
Ben-Gurion signed the declaration knowing the armies were coming. He signed it anyway. That was not optimism. That was a man who had done the math and decided the coin flip was worth taking.
Every Israeli government since has been making the same bet, on the same odds, in the same neighborhood.
487 is the latest data point in that series. It is not the last one.
Robert S. Miller built the Israel Security Index in June 2026 after writing about Trump’s Iran policy for Tablet magazine. The index tracks 42 prediction market contributors across four security clusters, updated weekly. The author holds no positions in any market tracked. Every input is a live market price; no values invented.